Fun With Science / Globe Deconstruction / Section · pages 110–112 / Refuted
Two Photographs That Have Been Argued to Death
Chicago from the Michigan shore, and the Lake Pontchartrain towers — pp. 110–112. A mechanism stated for Chicago, a question asked of Pontchartrain, both argued with the previous chapter’s tools and answered by them.
Stated for Chicago, asked for PontchartrainRefuted by the chapter it builds onFlat plane: air past overturning, at both lakes
Where this lands
The pictures are real, the events are documented, and the previous chapter already answers them. The book’s own resolution criterion at p. 102 keeps a 1,748-foot tower resolvable to 1,138 miles; the photographs are taken at 57. Haze fades and blockers cut, as his own pond and boat experiments showed, and the Chicago frames show a cut. Nothing at pp. 110–112 is measured in the book, and each case, measured, goes the other way: the time-lapse the book links has the bottom 190 m of the city behind the water on an evening whose weather predicts 112–198; the still’s “1,014 ft” is the schoolbook formula misapplied; the Pontchartrain clip cannot resolve the towers that would decide it. A flat plane produces these pictures only with air cooling upward at 125–227 °C per kilometre — four to six times past the gradient at which air overturns, and of the opposite sign to the one recorded: on the one dated evening, the air at the Willis roof would have had to be about −50 to −60 °C above a 6 °C lakefront. That is a price, not a stalemate.
Refraction is a quantity, not a verdict. The instrument that settles these pictures is a thermometer.
1 · What he states, and what he asks
Chicago is a statement; Pontchartrain is a question. Of the time-lapse, p. 111: “The camera’s angular resolution and haziness right above the water surface perfectly explain why the bottoms of the buildings are visually missing — no need for a physical hill of water.” That is a mechanism, asserted, and the catalogue tags the section as one that states. Of Pontchartrain, p. 112, the form changes: “We know the curve of the trees is not due to curvature, so why do we assume curvature with the power lines?” — the trees being the receding line at p. 104 that perspective bends across the frame — followed by an instruction to watch a video. A question carries no burden, so the two halves are answered differently: the statement is tested against measurement, and the question is answered — here is why curvature is assumed — with a note that the same tools would have settled both lakes, and were applied to neither.
2 · Built on the previous chapter — and undone by it
The chapter on angular resolution, pp. 96–107, is answered on the Bottom-Up Observations page, and much of it is conceded there: the one-arcminute criterion, that haze fades a distant object, and that something in the way cuts one off. His own pond and boat experiments demonstrate those rules; measured on his frames, the torch that vanished at half an inch of eye height vanished behind the debris his own slide shows, and the boat that lost its hull at one inch most likely lost it to chop, at a range where a globe hides nothing. Those tools are his, and here they run against him three times.
Resolution: his criterion, his number
The chapter establishes a range: an object stops being resolvable once its angular size falls below what the eye can separate, and the book puts that limit at p. 102 as 1/60th of a degree, one arcminute. It does not establish, and this review does not concede, that resolution takes an object from the bottom: resolution shrinks a whole object toward a blur and a point, and the last thing to go is the whole thing, not its base. But the range is the book’s own number, so take it at its word.
| object | resolution limit | curvature onset | ratio |
|---|---|---|---|
| a person, 6 ft | 3.9 mi | 3.0 mi | 1.3× |
| a ship’s mast, 60 ft | 39.1 mi | 9.5 mi | 4.1× |
| a lighthouse, 200 ft | 130 mi | 17.3 mi | 7.5× |
| Willis Tower, 1,748 ft | 1,138 mi | 51 mi | 22.2× |
Resolution distance grows linearly with height; curvature onset grows as its square root. They are closest at the height of a person, a factor of 1.3, and part company from there. Computed from the book’s 1-arcminute criterion; the same table on the Bottom-Up Observations page.
Haze: what it can and cannot do
Haze does something real: it lowers contrast along the whole path, and a layer thickest near the water dims the lower storeys more than the upper. What it produces is a gradient — a base fading toward the colour of the sky — never an edge. That is the site’s standing rule for things that vanish: perspective and resolution shrink and blur; haze fades; only a blocker cuts. So picture a hazed Chicago from that dune: every roof as far above the horizon as its whole stature puts it, the lower storeys paling into grey, and below that band the water horizon where the camera height fixes it, with nothing sharp between the last legible storey and the line. A fade, then a gap, then the horizon. The frames show the other thing: a level line with water below it, countable crisp storeys standing directly on it, and the roofs of four towers at the heights a hidden 138–203 m predicts rather than the heights their full stature would give. A mechanism that fades cannot produce that at any strength, and a haze thick enough to erase the base would not leave the storeys just above it crisp.
Blockers cut — and his own Chicago slide contains the gap
The third rule is the one his lake work established best: a cut needs a blocker. It need not be curvature, but it must be something across the sightline, and at Chicago that something has to stand in front of the bottom 140–200 m of a city ninety kilometres from a camera 59 m up. No wave does that. The chapter’s own Chicago slide already knows it: in text on the slide image, it grants that the city “should be hidden behind 2kft of curvature” and then supplies roughly 110 ft from the resolution limit, and never closes the gap between the two numbers. This page closes it, with a thermometer.
3 · A departure from his own method
The chapter sets its own standard at p. 92: clear days, repetition, ideal conditions, a test “perfectly reasonable with enough repetition.” Nothing at pp. 110–112 meets it. The time-lapse is linked and never read. The Michigan City still carries someone else’s overlay, 8″ × 39², a mis-measurement twice over. The Pontchartrain clip has no date and no camera height, and the reader is sent to a two-and-a-half-hour video in place of a number. Run the arithmetic the chapter asks for and every case comes out the other way. And none of it is new: the Grand Mere time-lapses were the news of April 2015, the Pontchartrain towers have been photographed, surveyed and simulated since 2017, and the “master class” is a 2024 reaction to a 2023 debate. They are the set-pieces of the genre, argued to death because both sides keep bringing pictures to a question pictures cannot settle. The standard debunk would do. What follows instead is the site’s method — identify and date the picture, measure it, put the day’s weather on it, and price the flat plane as a temperature gradient rather than a coefficient — because a globe at k and a flat plane at k − 1 are the same picture, and only the thermometer tells them apart.
4 · The Chicago time-lapse, measured
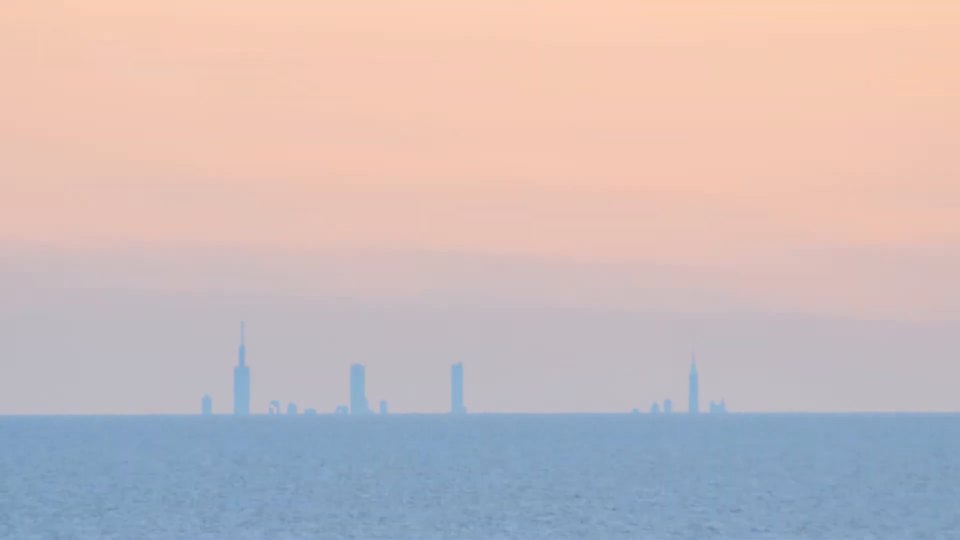
The book’s link (shapedebate.com/32) resolves to Joshua Nowicki’s Time-lapse: Looking toward Chicago from Michigan 2: the top of a dune at Grand Mere State Park, Stevensville, Michigan, 30 April 2015, a Nikon D5100 with a 70–300 mm lens and a 1.4× extender. The highest dune stands at 234.5 m in the USGS 3DEP model; the lake that evening was at 176.7 m on the Calumet Harbor gauge; with a tripod the camera was about 59 m above the water, and the Willis Tower is 90.8 km (56.4 miles) away. An airless globe hides 315 m of the city from there; standard air hides 237 m. The Willis roof is 446 m above the lake and its masts reach 531; the Hancock, Aon and Trump roofs are at 348, 350 and 361. So on an ordinary evening a globe predicts the four tall towers showing their top hundred metres or so and the Willis its top two hundred, with the city’s whole middle height behind the water. That is the picture.
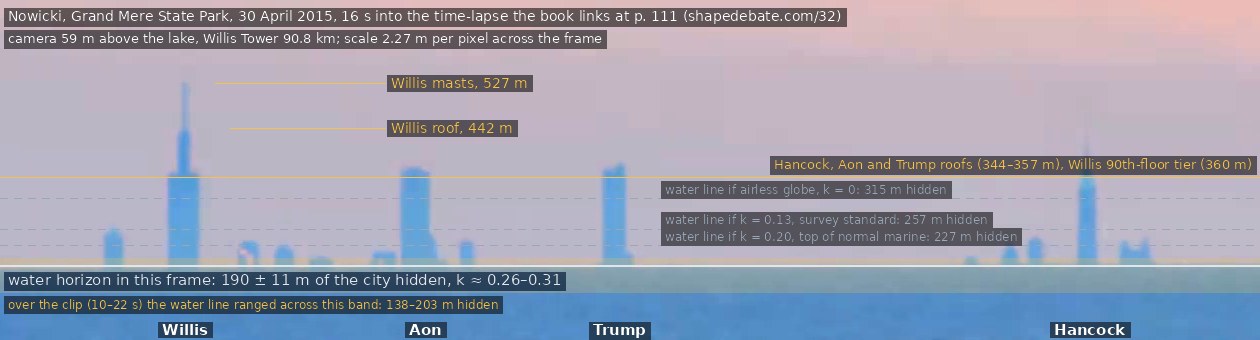
annotate_long_path_frames.py.What the frames show
The frames were read by machine (measure_chicago_frames.py, output in nowicki-2015-04-30-frames.json). Four silhouettes stand above a level horizon, and their spacing identifies them: from the Grand Mere crest the azimuths of the Willis, Aon, Trump and Hancock towers are 261.89°, 262.23°, 262.51° and 263.19°, so the other three stand 0.34°, 0.63° and 1.30° to the right of the Willis, offsets in the ratio 0.27 : 0.48 : 1; in the frame they stand 237, 435 and 906 pixels to its right, 0.26 : 0.48 : 1 (Aon and Trump are 0.28° apart, and the Trump is the one with a spire, which the frame puts on the far side). The same span fixes the horizontal scale, 2.27 m per pixel at the city — the one scale refraction cannot touch. Frame after frame the Hancock, Aon and Trump roofs sit at one level, and the wide block of the Willis ends there too, where its two-tube top tier begins at the 90th floor, about 360 m above the lake, with the tier and masts above it. Those are the heights the buildings have, in the order they have them: the air was not folding or flattening the skyline.
Fitting each frame’s feature rows against the buildings’ true heights gives the vertical scale, 1.75–2.5 m per pixel against 2.27 horizontally — little or no towering — and the cut, the true height at the water line: 138–203 m across the twelve seconds in which the masts are readable, median near 160. That band is wide for buildings known to the metre, for two reasons worth separating. Each frame’s value carries 10–40 m of error, because the cut is an extrapolation ninety pixels below the roof level and every pixel of reading error is levered into metres at the water. But the two best-read frames, at 10 and 20 seconds, give 147 ± 15 and 203 ± 14 m, a difference larger than either error: much of the spread is the air changing through the sunset, the distortion the book itself notices. The annotated frame above is the one at 16 seconds on its own, 190 ± 11 m, a coefficient of 0.26–0.31 for that frame (the clip as a whole spans 0.26–0.42), with the water line drawn where an airless globe (315 m), the survey-standard k = 0.13 (257 m) and the top of the normal marine range, k = 0.20 (227 m), would each have put it. The evening’s air lifted the city a few storeys more than standard air does, and not more than that.
The weather that evening
| station, about 00:50 UT (20:50 EDT, just after sunset) | air | wind |
|---|---|---|
| Benton Harbor airport, 6 km from the dune | 3.9 °C | calm to 3 kt |
| Michigan City airport | 3.0 °C | 5 kt N |
| Gary airport | 6.0 °C | 10 kt N |
| Calumet Harbor gauge, Chicago lakefront | 6.1 °C | — |
| Chicago Midway | 8.3 °C | 8 kt N |
| Lake Michigan surface, whole-lake satellite mean (GLSEA, day 120) | 3.6 °C | |
| Holland harbour gauge, water | 9.0 °C |
Dew points were −1 to +2 °C at every station and visibility 10 miles: dry, clear air after a north-wind day. Airport observations from the ASOS archive (Iowa Environmental Mesonet); gauge values from NOAA CO-OPS stations 9087044 and 9087031; lake surface from NOAA GLERL’s Great Lakes Surface Environmental Analysis.
Late April is the coldest the open lake gets relative to the air above it; the harbour gauge at Holland reads a warm shallow basin, and the whole-lake satellite mean is the better guide to water along a sightline that spends ninety kilometres offshore. Read together, the air over the path was warmer than the water by about one to three degrees, more at the Chicago end, in a shallow layer under light wind: a weak inversion, which is what cold water under milder air always makes. Traced through a layer like that — air 1 to 3 °C warmer than the water, decaying upward over fifty metres — the ray model hides 112 to 198 m of the city. The frames say 138 to 203. The weather and the pictures agree without a knob being turned.
The range: what lake weather can and cannot do
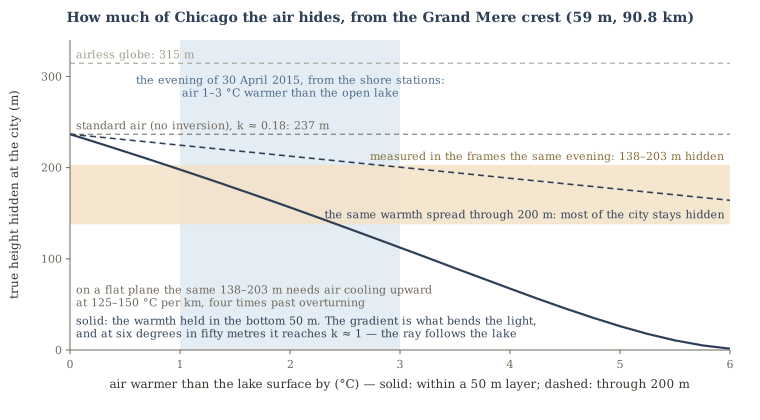
chicago_refraction.py.The same model gives the whole family. With no inversion the globe hides 237 m; at a two-degree inversion, 156; at four, 67; at six, the ray runs along the water and nothing is hidden — the ducting behind the full-height mirages of the city that make the news every spring. Six degrees sounds like very little to work such a change, and the reason it can is that it is not the warmth that bends the light but the gradient: six degrees held in the bottom fifty metres is +120 °C per kilometre at the surface, and that is k ≈ 1. The same six degrees spread through two hundred metres is a quarter of the gradient, and the dashed curve shows it hiding 164 m of the city still. The photographs of Chicago from Michigan are therefore not one phenomenon but a range, and how much of the city shows is a thermometer of the air over the lake. On a globe the air varies the height of the cut, inside a band the buildings’ known heights let us read to a few tens of metres. It never produces a cut where geometry predicts none.
What the flat plane has to buy
On a flat plane geometry hides nothing: from 59 m every storey of every building at 90 km is above the line of sight, and the only way to put water in front of the bottom 138–203 m of the city is for rays to curve upward, away from the surface, which air does only where it is denser above than below. Traced on the flat plane, the frames’ cut needs the temperature to fall by 125 to 150 °C per kilometre through the lowest few hundred metres along the whole ninety kilometres; a standard-air cut of 237 m needs 159. The gradient at which air overturns is −34.2 °C/km; this is four times that. In plain terms: the lakefront read 6 °C that evening, so the air at the Willis roof, 446 m up, would have had to be about −50 to −60 °C, and at the mast tips −60 to −74 — an Antarctic winter in the top storeys of a building whose lobby was in a light jacket, held steady over ninety kilometres of lake for the length of a time-lapse, on an evening when the measured air was warmer above the water than at it. It is the same price the Rampion page arrives at by another route: refraction could explain it either way, at a temperature profile the atmosphere does not have.
5 · The Michigan City still, and the drone
The second Chicago picture, at p. 111, is a sunset frame from the beach past the Michigan City East Pierhead light with the skyline behind it, carrying the overlay of the video it was cut from — “Nothing below this line should be able to be seen,” in the image; the book’s caption beneath reads “Everything below white line should be blocked” — a line labelled 1,014 ft against the Willis, and a table that says where the number came from: Formula = 8″ × Miles², 39 miles, 1,014 ft.
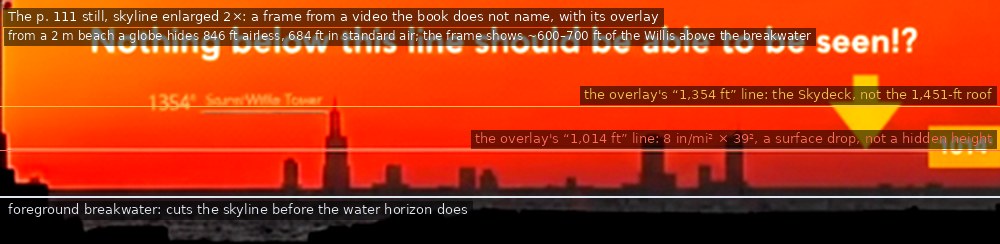
What the overlay claims. That 1,014 ft of the city should be hidden, so the towers on the horizon should not be there.
What it is actually claiming, once the measuring is put right. The 1,014 ft is 8″ × 39²: the drop of the water below a tangent at an eye of no height. It is not the hidden height for anyone on a beach, because a camera above the water sees over its own horizon and curvature hides only what lies beyond that. And “1,354 ft” is the Skydeck; the Willis is 1,451 ft to the roof and 1,729 to the mast tips, on ground 13 ft above the lake. Put the eye where the camera was, 2 m up on the beach at the light’s 38.7 miles from the tower, and the overlay’s own airless method gives 846 ft, not 1,014 (672 from the ten-metre bluff of Washington Park behind the beach). That is the claim corrected: on an airless globe the bottom 846 ft of the Willis should be missing.
What a globe with air predicts. Normal marine air, k = 0.13–0.20, turns 846 into 662–726 ft from the beach (510–566 from the bluff). No looming needed; it is what ordinary air does every day.
What the photograph shows. A bound, not a measurement, because the breakwater in the foreground cuts the skyline before the water horizon reaches it, and the frame is small. Scaled by the Willis masts (280 ft from roof to tip), about 600–700 ft of the building stands above the breakwater, so the water’s cut is 760–860 ft or lower: inside the globe’s range for a beach camera in ordinary air, without even the lift the Grand Mere time-lapse showed on its evening. The overlay’s 1,014 ft is not a globe prediction the photograph defeats. It is a number the globe never made for a person standing on a beach — and hiding 1,014 ft from a beach would need k = −0.18 even on a globe, −63 °C/km through the whole path, nearly twice the rate at which air overturns.
The drone clip the QR code beside it links (Timeless Aerial Photography, August 2024, “on a different day”) is the same pier from the air at sunset with no skyline in it: the sun setting in Chicago’s direction, the horizon white with glare, August air over a warm lake making no inversion. It is the right contrast to draw, and it separates two questions the page runs together: the air decides whether the city shows, and the buildings’ heights decide how much of it does. The first varies with the day. The second, on every day the city has been seen from that shore, has come back with the bottom few hundred feet missing.
6 · Pontchartrain: the line is its own measuring instrument
Geometry cannot decide; that concession is the whole of it. The refraction coefficient k is the fraction of the Earth’s curvature that air bends a ray to follow — about 0.17 in ordinary air — and a flat plane at k′ = k − 1 is exactly degenerate with a globe at k (stated on the method page, worked with a measurement on Mirrored Reflections). What that does not make the towers is a stalemate: the flat reading has a price, set by thermodynamics, and this line is built to charge it.
The usual dismissal — a receding line of towers looks like it dips whether the surface curves or not — confuses shrinking with hiding. Perspective shrinks distant objects; it does not amputate them. A straight line on a flat plane from a camera at any height to the foot of a tower at any distance lies above the water at every point, so the base is visible. From geometry, the amount of tower a flat plane hides is zero. And the line carries a scale bar: identical towers, evenly spaced at about 287 m (measured on the map; the line runs 24.3 km shore to shore), some ninety spans, countable in the frame. The range to each is known without a rangefinder, the surviving fraction of each is measurable in units of the tower itself, and one photograph yields an occlusion-against-distance curve ninety points long.
| tower | range | flat plane hides | globe hides |
|---|---|---|---|
| #30 | 5.4 mi | 0 | 2 ft |
| #50 | 8.9 mi | 0 | 17 ft |
| #70 | 12.5 mi | 0 | 45 ft |
| #89 | 15.9 mi | 0 | 86 ft |
Globe column: camera 2 m above the water, k = 0.17, ordinary air. The flat column is exact and does not depend on the tower height, which nobody has published.
To close a gap that runs from nothing to eighty-odd feet along the line, a flat plane needs rays bent the other way: by the degeneracy, k′ = −0.83, a lapse near −171 °C per kilometre through the whole thirty-metre band the towers occupy, over sixteen miles of open lake — five times the rate at which air overturns. A layer that steep is a chimney: it forms in the first centimetres over hot asphalt and convects itself away as fast as it appears. Nor does resolution rescue it: a hundred-foot tower at sixteen miles subtends 4.1 arcminutes, four times the criterion of p. 102, and something that resolvable does not lose its bottom eighty-six feet while its top stays sharp enough to count crossarms.
The replies. The line bends in plan — it does, and a plan bend moves towers left or right across the frame; it can change which tower a base sits behind, never whether water does, so the occlusion curve is untouched. The lake mirages — it does, in both directions: stable air over cool water lifts the towers and shows more of them, and a hot shallow surface at midday grows an inferior-mirage skin that hides things, but a skin a metre or two deep announces itself with inverted images and cannot draw a smooth curve of the table’s shape along sixteen miles. Chop — with the camera 2 m up and 0.3 m crests, the sightline to the farthest tower skims within crest height for the last 2.4 miles and can hide about a foot of base: a rounding error against eighty-six, and one more reason to want the camera height on the record. Camera height is the large lever: at sixteen miles the globe hides 102 ft from 1 m, 87 from 2, 62 from 5 and 15 from 20, so an unrecorded tripod turns one prediction into a family. Until a frame is reduced against a recorded height — the 2017 raw files are public, and the 2019 causeway survey exists — these photographs are strong evidence rather than a measurement.
The video the book links
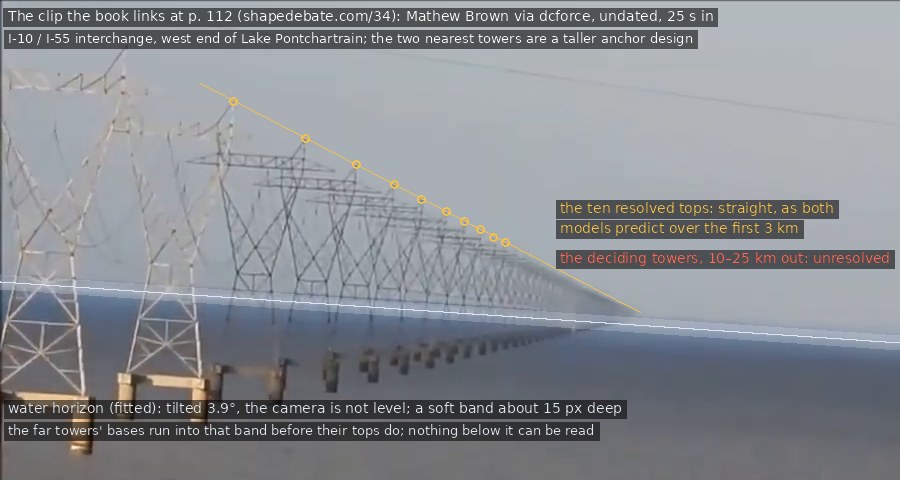
The QR code at p. 112 resolves to a two-and-a-half-minute clip re-uploaded in August 2021 as “Lake Pontchartrain Power Lines are LEVEL,” credited on screen to Mathew Brown, undated: handheld 720p from the I-10/I-55 interchange at the west end of the lake, the narration saying the towers “are perfectly level the entire way.” The frames were read for the one test that does not need the unrecorded camera height: equal towers on a straight line put their tops on a straight line in any photograph of a flat plane, and on a globe the line of tops sags. The ten towers the clip resolves are straight — but they span 3 km, over which a globe’s sag is 0.7 m and both models predict the same picture. The towers that would decide it, at 10–25 km, are the blur at the end of the zoom; even the horizon there is a soft band fifteen pixels deep, tilted with the camera. A line famous because its far end sinks is presented through the near three kilometres, where neither model hides anything, and the standard the chapter set itself at p. 92 — clear days, repetition, ideal conditions — is not one this clip meets. Its own far-end frames show the pile caps running into the horizon band while the tops continue above them, which is what a cut looks like and not what “level” looks like.
The “master class” at p. 112
The video the book asks its reader to watch all the way through is Taboo Conspiracy’s How to Fake the Curvature and Still Get Promoted by YouTube (March 2024, 2:32:05; Pontchartrain at 7:14–11:20). Its thesis: things vanish bottom-first for three reasons that are not curvature — waves in the foreground, an inferior mirage that swallows the bottom of a distant object, and the compression of distant images — and “refraction takes what is visible within your line of sight and distorts it, stretches it, compresses it, mirages and obscures your vision, but refraction is certainly not a vision enhancer that enables us to see around giant bulges of the earth.” So the 2017 photographs, with visible miraging along the horizon, are refraction; a second video with a Nikon P900, in which the far shore’s buildings can be seen, shows no such distortion and is the true view. That is the A-versus-B the book quotes.
It is right that blockers cut, which is this site’s standing rule too. What distinguishes blockers is arithmetic. A wave hides only what lies below the line from the eye over its crest, so it hides nothing unless the crest is above the camera: the segment’s worked example, a six-foot observer, a three-foot wave a quarter-mile off and a 250-foot ship at twenty miles, has that line dropping twelve feet per mile and passing 234 ft below sea level at the ship. Put the camera at two feet and the same wave hides the ship’s bottom 82 ft — 42 at ten miles, 162 at forty. A blocker hides in proportion to distance; curvature hides in proportion to its square; and a line of twenty-odd towers at known intervals is exactly the instrument that tells the two curves apart.
It is wrong about refraction, and the error is the dichotomy. Air bends every ray that crosses it, by an amount set by the temperature gradient along the path; ordinary air bends a horizontal ray toward the ground with a curvature about a sixth of the Earth’s, every day, whether or not anything shimmers. A picture with no visible distortion is not an unrefracted picture; it is one taken through air whose gradient did not change with height, so the whole scene bent together. Visible miraging says the gradient varied across the frame; it does not say refraction was present there and absent from the cleaner picture. And “refraction can obscure but never enhance” is simply not true of the atmosphere: rays bent toward the surface carry the view past the geometric horizon, which is what looming is. Ives, surveying the Gulf of California in 1951, reported mountains in Baja California “normally hidden below the visual horizon” being “regularly loomed into visibility” as the day warmed and sinking back with the night inversion — a thing that goes up and down with the thermometer on a schedule is a quantity, not a trick. The far shore’s buildings being visible in the P900 video decides nothing either: a globe in standard air shows them from a two-metre camera with the bottom twenty metres missing, and what would decide it is the amount missing, which the video does not measure. Refraction has a coefficient, the coefficient follows from a temperature profile, and the profile is bounded by things a person can record on the day. A method that sorts photographs by whether the horizon looks wavy has no way to be wrong and no way to be right; a method that records the conditions can be checked by anyone with the same instruments. The book asks its reader for facts. The instrument that finds them here is a thermometer.
7 · Every picture on one scale
The same question can be put to every picture on this page and answered on both surfaces at once: what does the air have to be doing for this picture to exist? Not as a coefficient — a globe at k and a flat plane at k − 1 make identical pictures, so no coefficient, by itself, can tell the two apart — but as the thing a coefficient is, a temperature gradient, which the atmosphere either holds or does not.
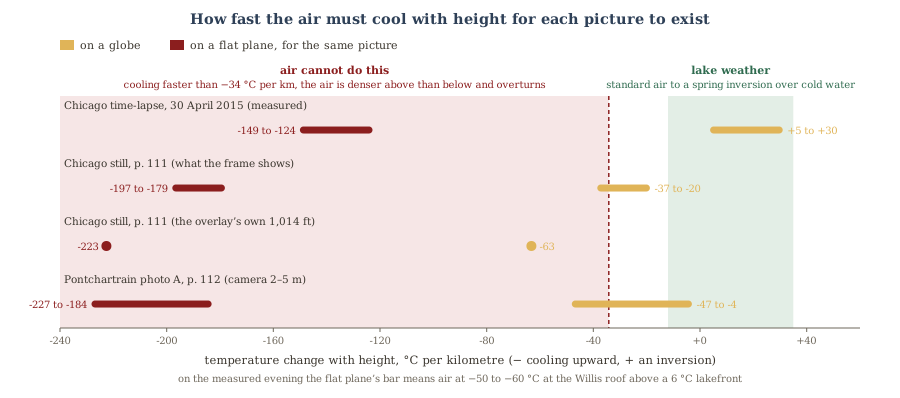
long_path_k_bands.py.The light bars are weather. The measured time-lapse needs +5 to +30 °C/km in the lowest layer (k 0.26–0.42): a mild inversion, which is what the shore stations recorded. The p. 111 still, bounded rather than measured, needs about k ≈ 0 to 0.09 from the beach, ordinary air or a little less. Photo A at Pontchartrain, its camera somewhere between 2 and 5 m, needs −0.07 to +0.17: standard air or the thin midday mirage skin the blue arrow at p. 112 is pointing at. On the measured evening, geometry hid 315 m and the air gave back 144 — refraction is doing real work in these pictures, and the work moves from day to day. The book noticed that, and it is right. The one light bar that is not weather is the overlay’s own number: k = −0.18 even on a globe, past the overturning line; the figure drawn to defeat the globe is one the globe could not produce either. (Photo B and the linked clip are not on the figure because they constrain almost nothing: with no camera height and no far towers, their bars would span the whole axis.)
The dark bars are not weather. Every one sits at −124 to −227 °C per kilometre, and every one is the same statement: on a flat plane geometry hides nothing, so all of what is missing — 170 m of Chicago, 23 m of tower — has to be put behind the water by light bending away from the surface, through the height of a skyscraper or a tower line, along tens of kilometres of open water; on the one dated evening, that is air at −50 °C or colder at the Willis roof above a 6 °C lakefront, and for the overlay’s number, −93. The atmosphere does hold such gradients — in a skin 10–20 cm deep over hot sand or a warm lake at noon, the inferior mirage, which hides about an arcminute at the apparent horizon. It has never been measured holding one through thirty metres, let alone three hundred. So the discriminator is not k, which cannot discriminate, and not the pictures, which are the same on both surfaces by construction. It is the meteorology: the light bars land where lake weather lives and move about inside it; the dark bars land where no weather has ever been recorded, at the same place every time, whatever the picture. The variation the book reads as refraction being invoked selectively is the globe column doing what weather does. The flat column stays parked where thermodynamics put it.
The other dated sightings
The book’s clip is one of a series from the same photographer, and not the only witness. Nowicki’s still from the same dune two days earlier (28 April 2015), his time-lapse of 17 April 2016, the inverted mirage from New Buffalo on 17 April 2017, the Warren Dunes video of 5 May 2019 and the night time-lapse of 2 April 2020 are all dated in his captions, all in April–May when the lake is coldest against the air. Independent of him: Sam Cornwell’s photograph from Mount Baldy at 19:45 on 10 September 2008 (37 miles, 38 m up, exposure data published by the Earth Science Picture of the Day), and a Memorial Day 2025 sighting from Tower Hill, Warren Dunes, reported with air in the mid-70s °F over a 49 °F lake. Each is a point on the curve above; none has been reduced frame by frame as the book’s clip has.
What would change our mind, and where this page could be wrong
- The camera height is inferred, not recorded. “The top of a dune” has been taken as the highest crest at Grand Mere, 59 m above the water. A 45-metre dune moves the standard-air cut from 237 to 268 m and the two-degree cut from 156 to 184; a 70-metre one moves them to 217 and 139. The frames’ measured band does not move with it, so a lower vantage implies a slightly stronger inversion, not a different conclusion.
- The frame heights carry error. The roofs are known to the metre, but the Willis 90th-floor setback is placed at 360 m from a uniform floor height (±10 m), the video is a compressed upload, and the rows are read to three or four pixels, 7–10 m at the city.
- The temperature profile is a model. No sonde flew over the lake that evening; the inversion is bracketed from shore stations and a whole-lake satellite mean, and its shape (exponential, fifty-metre depth) is assumed. A measured profile could sharpen or loosen the agreement; it could not change the sign of what the flat plane needs.
- No Pontchartrain frame has been reduced here. The tower height (23 m) is from a published reconstruction, not the utility; the camera height is bracketed, not known. An occlusion curve measured tower by tower against a recorded camera height that departs from the globe prediction by more than the frame can bear would change the reading.
- A measured super-autoconvective column. A profile over open water — sonde, drone or instrumented mast — showing a lapse near −150 °C/km held through tens of metres for the length of an exposure would retire the thermodynamic argument on every page that uses it. So would paired observations with a thermometer: the same skyline photographed under measured profiles with the building bases at a height a flat plane predicts and a globe does not.
Sources & further reading
- Levi Miller, Globe Deconstruction? (prerelease) — pp. 110–112, the angular-resolution chapter at pp. 96–107, and the 1/60th-of-a-degree criterion at p. 102. The book’s link for the time-lapse, shapedebate.com/32, redirects to the video below.
- Joshua Nowicki, “Time-lapse: Looking toward Chicago from Michigan 2”, YouTube, uploaded 1 May 2015; shot 30 April 2015 from Grand Mere State Park (caption and description). His dated series: the 28 April 2015 still; the 17 April 2016 time-lapse; the 17 April 2017 New Buffalo mirage (Chicagoist); the 5 May 2019 Warren Dunes video; the 2 April 2020 night time-lapse.
- The book’s other links on these pages: shapedebate.com/33, the Michigan City lighthouse drone clip (Timeless Aerial Photography, uploaded 13 August 2024); shapedebate.com/34, “Lake Pontchartrain Power Lines are LEVEL” (dcforce, uploaded 13 August 2021, credited on screen to Mathew Brown). Michigan City East Pierhead light to the Willis Tower: 62.4 km, 38.7 miles.
- The Reverse Refraction Solver on this site: enter what the camera saw, and it returns the coefficient and gradient a globe and a flat plane each need. Its forward counterpart, Walter Bislin’s Advanced Earth Curvature Calculator, is the standard tool for prediction.
- Pontchartrain line geometry: tower spacing about 287 m and a 24.27 km crossing, from the map measurement at flatearth.ws/pontchartrain; the 2017 photographs and their analysis, Metabunk, July 2017; the causeway GNSS survey, Jesse Kozlowski, January 2019.
- Ronald L. Ives, “Recurrent mirages at Puerto Peñasco, Sonora,” Journal of the Franklin Institute 252 (4), 285–295, October 1951 — looming of the Baja California mountains as a routine midday condition on the Gulf of California.
- shapedebate.com/35: Taboo Conspiracy, “How to Fake the Curvature and Still Get Promoted by YouTube”, uploaded 2 March 2024, 2:32:05; the three-mechanism thesis at 1:10–3:35, the Pontchartrain segment at 7:14–11:20, the refraction principle quoted at 8:01–8:20.
- Sam Cornwell, “Mirage of Chicago Skyline”, Earth Science Picture of the Day (USRA), April 2020 — Mount Baldy, 10 September 2008, 19:45 CDT, with exposure data. The 2025 Warren Dunes sighting: WGRD, 28 May 2025.
- Weather: hourly airport observations (BEH, MGC, GYY, MDW, SBN) from the Iowa Environmental Mesonet ASOS archive; air temperature and lake level at NOAA CO-OPS 9087044 Calumet Harbor and water temperature at 9087031 Holland; lake-average surface temperature from NOAA GLERL GLSEA. Dune height from the USGS 3DEP elevation point query service.
- Building heights: Council on Tall Buildings and Urban Habitat (Willis 442.1 m roof, 527.3 tip; Trump 356.9 / 423.2; Aon 346.3; John Hancock 343.7 / 457.2). The ray model, the frame measurements and the figure:
chicago_refraction.pyandmeasure_chicago_frames.py. - On this site: Bottom-Up Observations (the resolution arithmetic), The Black Swan (long-path atmospheric cases), Mirrored Reflections (the degeneracy, worked with a measurement), Method & Foundations (the standing argument).