Fun With Science / Globe Deconstruction / Claim #3 · page 2
The eclipse came in from the wrong side
The fourth limb of Claim #3 — a real measurement, held against a motion it was never going to match.
He drew a line thirty-seven degrees long and asked whether a one-degree motion lay along it.
Claim #3 (p. 2) lists four “red flags” and this is the last of them: the failed trajectory alignment during a solar eclipse. The book does not work it out; the argument lives in a video the book links, and it is not the book’s own. It belongs to a named third party with a real instrument, and it deserves to be answered as such.
Claim fails The measurement is right; the zero it is tested against is a premise no model makes.
The claim. Filmed from Erie on 8 April 2024, the Moon arrived on the Sun about 35° off the Sun’s daily arc. The video calls that impossible: a body crossing the Sun should have come in along the arc the two shared that day.
The numbers. Computed for his coordinates, the Moon sits 33 to 38° off the arc every minute the two discs are far enough apart to have a near side. His measurement is sound. But the daily arc is the Earth’s rotation, shared by the whole sky; it adds nothing to the distance between Sun and Moon. The approach runs along the Moon’s own orbit, and the tilt is the angle that orbit makes with the arc, seen from where he stood. A zero is what a bead on a wire would do. No model of the sky, flat or round, offers one.
The check. The same computation says the bite in the Sun must swing from the lower right before totality to the top after it. His own three post-totality frames — 15:23, 15:25 and 15:46 — have it at the top.
Whose argument this is
The book’s QR reaches an upload on the Shape Debate channel titled sun observations; at 24:04 it becomes a rebroadcast of an episode of Hanging On His Words, whose guest is Jeremy McGarry. The argument, the camera, the frames and the slides are all his. The original is What Did the Sun ECLIPSE? | w/ Jeremy McGarry, streamed 19 June 2024. So the answer is addressed to him, and the credit for the work is his too.
How an eclipse happens
Everything that follows is an argument about which motion does the work, so first the mechanism. The chart below was built on this site for a different eclipse — Reykjavík, 12 August 2026 — before the event: nine days of Moon paths above one horizon, and over them two sets of dots, each body’s place at the same clock time every day, 17:50 UTC.
The Sun’s nine dots pile up under a thumbnail: at a fixed hour it comes back to nearly the same place, sliding a quarter of a degree a day with the season. The Moon’s nine march straight across the chart, about fourteen degrees of azimuth a day, run into the Sun’s clump on the 12th and carry on out the far side at exactly the same pace.
Erie on 8 April 2024 is the same picture from another spot on the globe, with numbers all its own and the same pattern: a Sun that returns to nearly the same place at a fixed hour, and a Moon that walks past it at its own pace and keeps going. His camera recorded exactly that for weeks. The disagreement is entirely about the step after that.
The chart is reproduced here from Where’s the Moon’s Silhouette?, unchanged. Positions from Astronomy Engine, cross-checked against JPL Horizons, baked into the chart rather than computed in the browser.
What he did
He mounted a Brinno TLC2000 time-lapse camera to his house about three weeks before the 8 April 2024 eclipse, left it fixed, and had it take one frame a minute. From the frames he traced the Sun’s daily path and the Moon’s, and established that on eclipse day the two coincided. His slide states the premise plainly:
“Blue line is the same trajectory path of the Sun. The Moon must match exactly at 15:18 on Apr 8 for total solar eclipse. The moon trajectory on March 24, 2024 is approximately the same height as the Sun trajectory on April 8, 2024.”
The height comparison holds too, as far as it goes: at its highest point of the day — its culmination — the Moon’s arc on 24 March topped out at 52.4° and the Sun’s on 8 April at 55.4°. But one word in that sentence is carrying more than it can. The Moon does not have a trajectory the way the Sun does. Its arc drops or climbs six or seven degrees a day, and across the fortnight between his two dates it swings through fifty-six degrees, from 74.7° on 18 March down to 18.4° on 1 April and back up to 54.9° on eclipse day:
| Highest the Moon gets, Erie | 18 Mar | 21 Mar | 24 Mar | 27 Mar | 1 Apr | 5 Apr | 8 Apr |
|---|---|---|---|---|---|---|---|
| altitude at culmination | 74.7° | 63.3° | 52.4° | 34.9° | 18.4° | 32.9° | 54.9° |
That swing is a sweep — bounded and periodic. Across 2024 the Moon’s culminating altitude at Erie stays between 18.3° and 76.3° and runs the width of that band and back every tropical month, a little over twenty-seven days. The Sun’s eclipse-day arc, 55.4°, sits inside it, and any level inside a sweep like that is crossed twice a cycle: the Moon crossed 55.4° twenty-seven separate times in 2024, on average every 13.6 days, and culminated within three degrees of it on 25 days of the year. His two dates are one falling crossing, between 23 and 24 March, and one rising crossing, 8 April itself.
One wrinkle, and it cuts his way first: near the turning points the Moon lingers — it culminates within three degrees of 20° on 64 days of the year — so a low match would smear across a week. At 55° it is in the fastest part of the sweep, a median 5.7° a day and up to 7.7° against a median 2.3° near 20°, so the crossing lands on one or two dates. That is why his comparison reads as a near-identity; it is also, precisely, the Moon migrating at speed. Conventions: the counts are calendar days of 2024 whose culmination lies within three degrees of the level; the rates are the change from one day’s culmination to the next, taken over days within five degrees of it.
What the globe predicts for Erie, and what his camera recorded
The first stretch of his raw footage runs from 23 to 25 March. Sorted into tracks by nothing but how they move, only the Sun and the Moon travel a long smooth path for hours: 1,256 positions, 722 of the Sun and 534 of the Moon, across the full width of his frame, with no ephemeris consulted in choosing them. His camera was then given a plate solution — where it points, how long its lens is, how much its fisheye bends straight lines, fitted from bodies of known position — on the Sun alone. That solution never saw the Moon.
| Applied to | n | Median miss |
|---|---|---|
| the Sun, which it was fitted on | 556 | 0.35° |
| the Moon, which it never saw | 534 | 0.63° |
| the Sun on 7 April, two weeks later, nothing refitted | 239 | 0.64° |
Frame counts, rejections, the lens model and the clock the 7 April row uses are in the Method notes at the end.
Below, the same model draws both arcs over Erie for each of the twenty-two days from 18 March to 8 April, both bodies moving at the same instant. Each day leaves a dot at the Moon’s highest point, and the readout counts down how far the Moon still has to travel to reach the Sun: 250° on 18 March, falling by ten to fourteen degrees a day, 0° on 8 April. On the four days his footage can be measured — 23, 24 and 25 March, and 7 April — his own positions appear along the arcs.

data/erie-skytrack.json, which build_erie_skytrack.py writes from DE421 at his printed coordinates; the chart computes no astronomy of its own. His stated 43-minute clock correction is assumed rather than fitted — this footage cannot determine it. 22 March carries no dot because that calendar day contains no meridian crossing: a lunar day runs about 24h 50m, so roughly once a month one falls out. If the chart cannot run here, a still stands in.Eclipse afternoon itself is not on the chart, and not because his camera failed. Before totality Erie is under broken cloud and no smooth track survives. After it the same solution follows the Sun for an hour and a half and puts it a median 1.5° from where the ephemeris says it was, 86% inside two degrees — a real recovery on the disputed afternoon — but the residual is the lens, not the sky (Method notes), so those positions appear once, labelled for what they are, in the last act of the scene below.
The step that does not follow
From “the Sun and the Moon share a path that day” he goes to: the body that crossed the Sun should have travelled along that path. It came in from below and to one side, and that is what he calls impossible. Forty-six minutes in, he gives the model it rests on:
“This cable or wire that these beads move across — that is fixed, it’s not random. If one of the beads is sliding across it, you can’t come at it at a different angle, it has to slide across that cable or the wire. And the blue line across the top is the trajectory of the Sun during the eclipse.”
Spoken on the broadcast rather than printed on a slide, and checked against the audio.
Relative to the Sun, the Moon really does move mostly along the shared arc rather than across it. Decomposed at his site on his afternoon, the along-arc part of that motion is between 76% and 98% of the whole, running backwards down the track: the Moon sits ahead of the Sun in the morning and falls back through it.
The eclipse does come in near the shared track. The question is only how near, and what “near” is supposed to be.
The number he actually measured
So the disagreement is about one angle: how far off the arc the Moon sits as it crosses. Directions on the sky are given below as position angles — the direction of one body from another, counted from straight up. Computed for his coordinates, from an ephemeris, with no reference to his footage:
| 8 Apr 2024, Erie PA | Where the daily arc points the line on his slide | Where the Moon sits the side the bite is on | Tilt off the arc |
|---|---|---|---|
| 13:30 EDT | 94° | 132° | 38° |
| 14:28 EDT | 112° | 148° | 36° |
| 14:50 EDT | 117° | 152° | 35° |
| 16:00 EDT | 130° | −15° | 36° |
| 17:00 EDT | 135° | −10° | 34° |
Angles at the Sun, positive toward increasing azimuth. The tilt is measured against the arc as a line rather than a direction, which is why it stays around 35° while the bite swings from one side of the disc to the other. Within about ten minutes of totality the two discs are nearly concentric and there is no side to measure, so those minutes are left out. DE421 via Skyfield, topocentric — computed for his spot on the surface rather than for the Earth’s centre — at his printed coordinates. Reproduce with python3 eclipse_trajectory.py.
The mechanics, at true scale
The chart earlier is the Moon’s walk seen from the ground, because the ground is where he measured. What follows is the same fortnight seen from outside, with nothing drawn to a false scale: the Sun 696,000 km across and 150 million km away, the Earth 6,371 km in radius, the Moon 1,737 km in radius and, that afternoon, 359,000 km off. At the zoom where the Moon’s orbit fills the frame the Earth is ten pixels across and the Moon three, because that is what they are from a million kilometres, so a thin dashed ring sits round each body to say where it is.
His question is how the Moon could come in from behind and below on the same track. It is not on the same track. It is on a narrower, faster orbit — round the Earth, not round the Sun — and in the fortnight from the full Moon of 25 March to the new Moon of 8 April it is carried half way round that orbit, from the far side of the Earth to the near side, while the Sun, seen from the Earth, moves fourteen degrees along its own path. “Behind” is the half-turn. “Below” is the tilt of the orbit.

- Act 1 — the nest of orbits. From above the Sun, far enough out to hold the whole of the Earth’s orbit, the Moon’s orbit is smaller than the dot that marks the Earth. Then in, five hundred times, until the Moon’s orbit fills the frame and the Moon swings from the night side round to the day side.
- Act 2 — the alignment, frozen. The clock stops at 13:00 EDT on 8 April and the camera walks round it: the Moon’s orbit tilted 5.3° to the Earth’s, crossing it at the node the Moon had passed that morning, at 12:18 UT — six hours before the shadow’s axis passed closest to the Earth’s centre, seven before totality at Erie — with the line of nodes pointing 3.8° from the Sun, which is why this month and not every month.
- Act 3 — the shadow. The umbra is a needle 175 km wide where it lands — one part in seventy of the Earth’s width — and it crosses the United States at about 3,000 km/h over the ground, 3,700 by the time it reaches Erie, while the ground under it turns east at 1,240. The act follows it from Mexico to Indiana, 750 km short of Erie and eleven minutes off.
- Act 4 — from Erie. Down to the ground as the shadow arrives, and up at the Sun: a crescent on the upper left, the Moon having come in from the lower right — position angle 232° at first contact, south-west on the sky. Then totality, and the view turns into his camera: his bearing, his tilt, his lens, as solved on the Sun in March.
- Act 5 — his frame. The model, rendered through his lens at 15:17:35 EDT, fades into the frame his camera took at that instant — camera clock 14:36:11 plus the 41.4 minutes the eclipse itself measures. The ring is where the model puts the Sun; the point of light is where his camera has it: 15 pixels apart, 1.2°. Then out through fourth contact, his measured Sun riding along as gold dots, a median 1.5° from the model’s, with an inset five degrees wide showing the Moon drawing off the Sun to the upper left.
data/eclipse-mechanics.json, which build_eclipse_mechanics.py writes from DE421; the scene computes no astronomy of its own. The still is one frame of his time-lapse, reproduced for review. If the scene cannot run here, a still stands in.Why it came from below
Three motions are in play, and the arc is only one of them. The Earth’s rotation carries the whole sky round once a day at a single rate — Sun, Moon, Orion, all together. That is the daily arc, and because it moves everything at once it adds nothing at all to the distance between the Sun and the Moon — on any model of what the sky is. The Sun has a track of its own, about a degree a day, of which he photographed eight degrees in three weeks. And the Moon is the fast one, better than twelve degrees a day relative to the Sun. That is the motion that closes the gap, and nothing else in the sky shares it.
So the approach runs along the Moon’s own road, and the only question is what angle that road makes with the arc. Two tilts and a standpoint answer it. The Earth’s axis leans 23.4°, so the Sun’s yearly path — the ecliptic — is not the celestial equator that the daily arc follows; the Moon’s orbit leans a further 5.1° off the ecliptic; and the observer is not at the centre of any of them. Measured in the sky’s own frame, where the daily arc simply is a parallel of declination (a circle of constant celestial latitude) — no horizon, no fisheye:
| What is being added | At greatest eclipse | Across the afternoon |
|---|---|---|
| the ecliptic on its own — the Sun’s own annual path | 22.3° | fixed |
| … plus the Moon’s orbit, inclined 5.1° to it | 27.8° from the Earth’s centre | holds still — 28.1° to 27.7° |
| … plus standing on the surface rather than at the centre | 37.1° from Erie | rotates — 40.9° to 34.1° |
The direction of closing at one instant, not a line fitted through the whole passage — from a place on the surface there is no single direction to fit. The middle column is taken at greatest eclipse and the right-hand one at first and last contact. DE421 via Skyfield; every figure in it is re-derived from the ephemeris by tests/test_eclipse_trajectory.py, which fails if the page and the sky disagree.
That last term is a prediction, because it depends on where the observer stood. Everyone on the 2024 path saw the Moon arrive at a measurably different angle — more from below, the further south:
| Seen from | Mazatlán | Dallas | Indianapolis | Erie | Montreal | Earth’s centre |
|---|---|---|---|---|---|---|
| tilt at greatest eclipse | 44.8° | 41.8° | 38.6° | 37.1° | 35.4° | 27.8° |
| and how far it rotates | 0.7° | 3.7° | 5.9° | 6.8° | 7.3° | 0.3° |
Millions of people photographed that eclipse. If the angle the Moon came in at is the same everywhere along the path, this account is wrong and his is closer to right. If it slides down the path in the order above, the tilt is telling you the size and shape of the thing you are standing on. The second row needs only one observer with a sequence of frames from a fixed camera. Seven degrees is small against the error bars on a hand-measured photograph, so it is a test for a careful sequence; his own nine moments are on the edge of it, which is why the page does not claim to have run it.
A scale worth holding onto: across the two and a half hours of partial phases the Sun and Moon together sweep 37° across the sky, while the Moon moves 1.1° relative to the Sun — both angles taken on the sky, not off the pixels of his fisheye, which bends the one and not the other. Better than thirty to one. The zero he tested against is one that only the wire asks for.
Nor is it the flat plane’s prediction. The usual reply is that on a flat plane the Moon’s arc changes height from day to day as well, so the sweep belongs to that picture too — and it does, which is the point. Any picture in which the Moon’s arc changes height from one day to the next, as his own table shows it doing, has the Moon moving between arcs to reach the Sun, not along one; a zero tilt needs an arc whose height does not change. His table has the height changing by a median 5.7° a day at the Sun’s level while the Moon closes along the arcs at a dozen degrees a day — several degrees across for every dozen along, on any model that reproduces his numbers. No flat-plane account offers an ephemeris from which its angle could be computed, so there is no flat-plane figure to set beside the 37.1° above; but whatever it is, it is not zero, because zero contradicts the table he drew himself. A flat-plane account owes one more number: the shadow crossed the ground at about 3,000 km/h, cast by a Moon that moved 1.1° against the Sun in two and a half hours. On the globe that is orbital motion carrying a needle-thin umbra (the shadow’s dark core) across the ground from 359,000 km away; a local Moon over a flat plane has to produce that ground speed from that sky motion, and that figure has, to our knowledge, never been supplied.
Where “fifteen or twenty degrees” comes from
The “15, 20 degrees” was said by the co-host over one slide: his time-lapse frame with the trajectory drawn across it, beside his Nikon P1000 close-up of the bitten Sun, with the trajectory line moved down onto the photograph to show it does not match. Measured off that frame — his curve traced and its tangent taken where the Sun sits, his red line fitted to its own pixels:
| Position angle from straight up | His slide | The model |
|---|---|---|
| his trajectory line, in his own frame | 96.3° | 97.4° |
| his red line across the Nikon photograph | 141.1° | 148.1° |
| between the two, as he draws them | 44.8° | |
| between them measured consistently — both in his frame, or both on the sky | 36 to 38° | |
His trajectory blow-up is stamped 14:23 and the Nikon frame 14:28; five minutes moves either angle by about a degree. The 7° between his red line and the model’s bite direction is within the roll of a hand-held Nikon, which the photograph does not record.
The first row is the one to notice: he drew the trajectory correctly. Solving his camera from his own raw frames puts the Sun’s daily arc at 97.4° in that frame; his hand-drawn curve reads 96.3°. The second row is where it goes. A fisheye bends the arc that runs at 110° on the sky to 97° where his Sun sits; the Nikon close-up has no such bending. The two lines are measured in two different projections, so the 45° he gets is not the tilt; taken consistently either way, it is 36 to 38°. The lens is worth 13° of rotation on its own; about half of that happens to be cancelled by his red line sitting 7° off the model’s bite direction, the sort of thing an unrecorded camera roll does. The two errors are unrelated. Elsewhere he labels the curved roofline, horizon and road “Fish-Eye Lens”, four times over, and sets all three aside as artifacts — disowning the easiest available argument in his own favour. None of which rescues the argument: the premise needs zero. And “fifteen or twenty” is an eyeball estimate of an angle that measures forty-five on the frame it was said over.
The approach is tabulated on the slide that says it is missing
One of his slides puts two U.S. Naval Observatory tables side by side — Altitude and Azimuth of the Sun and of the Moon, both for Erie PA at N 42° 08′, W 80° 05′ on 8 April 2024, sixteen rows each from 08:00 to 18:00, under a caption:
“The Sun and Moon are on the Same Trajectory”
The tables are sound: checked row by row against DE421 for the coordinates printed on the slide, every one of the sixty-four figures agrees to 0.08° or better, which is the rounding. But the two columns are only “the same” while they are read one at a time. Subtract them and what comes out is the approach — the motion the slide is being used to say did not happen.
| EDT | Moon − Sun, altitude | Moon − Sun, azimuth | Gap between them | Which side of the Sun the Moon is on |
|---|---|---|---|---|
| 08:00 | +0.6° | +3.4° | 3.38° | right |
| 10:00 | +0.1° | +2.8° | 2.33° | right |
| 12:00 | −0.4° | +2.1° | 1.38° | right |
| 14:00 | −0.5° | +0.6° | 0.61° | lower right |
| 15:18 | 0.0° | 0.0° | 0.00° | the eclipse |
| 16:00 | +0.3° | −0.1° | 0.31° | top |
| 17:00 | +0.7° | −0.2° | 0.72° | top |
| 18:00 | +1.3° | −0.2° | 1.31° | top |
Computed from the figures printed on his slide, nothing else. The same residual taken from DE421 agrees to 0.05° in size and 1–4° in direction at every row.
Read down that last column. The Moon starts the morning three and a half degrees to the right of the Sun — seven Sun-widths — closes on it all day, arrives at 15:18, and opens out again on the opposite side, a degree and a third above by six in the evening.
That is the approach. It is in his own numbers, on his own slide, under a caption saying the two are on the same path.
Both things he says are true at once. The two bodies are on the same trajectory — the daily arcs match to a few tenths of a degree all day, which is what his caption is reading — and the Moon is crossing the Sun. The trajectory is what they share; the residual is what one does relative to the other. Only the second can cause an eclipse, and it is the column his slide does not compute. It also settles the photographs: his table has the Moon to the lower right of the Sun through the afternoon and above it afterwards — the same rotation the next section predicts from an ephemeris, arrived at here from nothing but his own two columns and a subtraction.
He built the right instrument, and stopped one layer short. The Reykjavík plot at the top of this page is a chart of exactly his kind — fix the observing point, draw the daily arcs, see where the two bodies fall — plus one layer of marks: where each body stood at a fixed clock time, one dot per day. Those dots are the same subtraction, sampled once a day:
| Reykjavík, at 17:50 UTC | 8 Aug | 12 Aug | 16 Aug |
|---|---|---|---|
| Moon azimuth | 310° | 253° | 199° |
| Sun azimuth | 253.4° | 253.0° | 252.6° |
| Between them | 55.2° | 0.0° | 51.6° |
The Sun’s nine dots span eight-tenths of a degree; the Moon’s close on the Sun at about 13½° a day, and at Erie the same march closes at 13.8° a day. On that chart the daily arc at totality runs at 116° and the day-to-day dot track at −88° — 156° apart, the dots running back down the arcs rather than across them, against 143° at Erie; the projection into a local horizon depends on where you stand, but the approach is never in the arc. Read over ten minutes instead of two days the Reykjavík approach is −93° against −88°, so the sampling does not matter. The fixed-hour marks were in his own three weeks of frames the whole time; he might read the same dots another way, but the quantity was his to plot, and the instrument he built was good enough to show it.
What the model says his own photographs should show
This part can be checked rather than argued: he puts up the Sun at nine moments through the event — eight photographs of his own and, for the last, an animation. The bite appears on the side the Moon is coming from, and that direction rotates.
| EDT | Against totality | Separation | Bite direction | Where it sits in a level frame |
|---|---|---|---|---|
| 14:23 | −55 min | 24.0′ | 147° | lower right |
| 14:43 | −35 min | 15.4′ | 151° | lower right |
| 15:01 | −17 min | 7.5′ | 154° | lower right |
| 15:12 | −6 min | 2.7′ | 154° | lower right |
| 15:18 | totality | 0.2′ | — | — |
| 15:21 | +3 min | 1.2′ | −11° | top |
| 15:33 | +15 min | 6.5′ | −17° | top |
| 15:53 | +35 min | 15.5′ | −15° | top |
| 16:13 | +55 min | 24.5′ | −13° | top |
Separations in arcminutes (′), sixtieths of a degree.
His Nikon P1000 frame at 14:28 has the bite at the lower right. So does the line above it. The observation he presents as impossible is the one the model puts there, and the computation makes no reference to his photograph.
The bite direction turns through about a hundred and sixty degrees across the event. No straight line can do that. It is the wrong kind of object to hold an eclipse against.
That gives the page a prediction rather than a rebuttal, because his set does not stop at totality. He shows three Nikon frames after it — stamped 15:23, 15:25 and 15:46 — and the model says that in every one of them the bite must be at the top of the disc, opposite the four before. It is. In all three the lit crescent lies at the lower right and the Moon covers the upper left, the mirror image of his 14:28 frame; and the small diagram he draws beside each puts the Moon above and to the left of the Sun after totality, having drawn it below and to the right before. The fourth slot in his sequence, at 16:13, is labelled on his own slide as a timeanddate.com animation rather than a photograph, so it is not counted. Had any of the three shown the bite still at the lower right, this account would have been wrong.
His own footage records the eclipse, to the minute
The second of his two raw footage stretches runs from midday on 7 April to the evening of the 8th on his camera’s own burnt-in clock — so the eclipse is inside it. Through that afternoon the sky carries thousands of saturated pixels. In one window, and nowhere else in daylight, the count falls to zero:
| His camera clock | 14:34.6 | 14:35.8 | 14:37.1 | 14:37.9 | 14:38.7 |
|---|---|---|---|---|---|
| saturated sky pixels | 35 | 0 | 0 | 0 | 2,733 |
| brightest tenth of a percent | 238 | 208 | 193 | 203 | 248 |
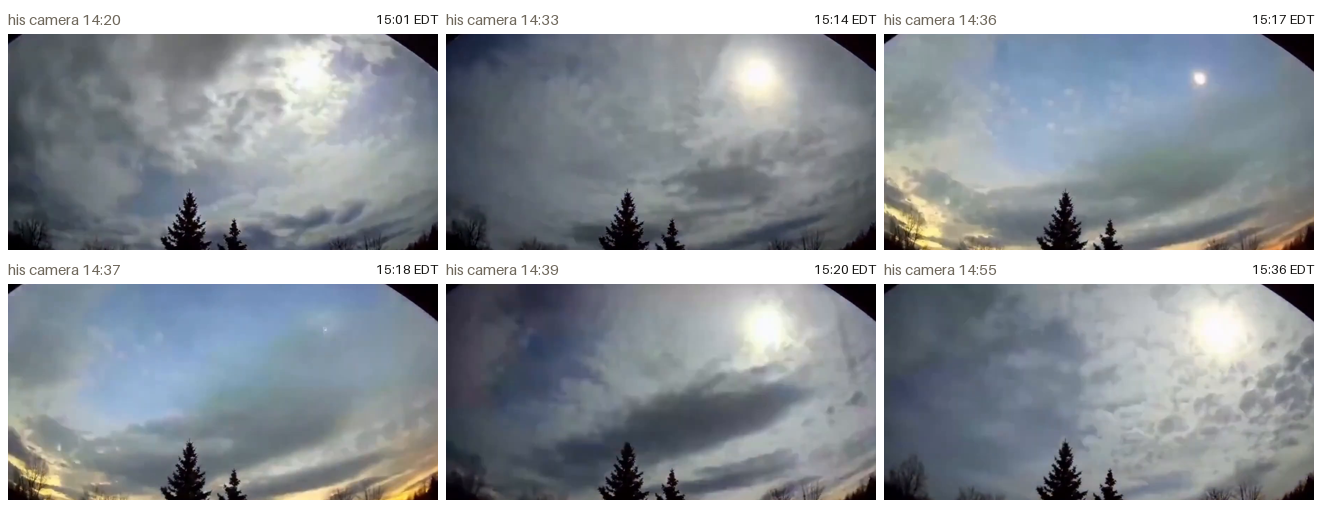
The sky says when that happened: by DE421, totality at Erie runs 15:16:23 to 15:20:06 EDT (the note at the top). Requiring his dark window to lie inside that brackets his camera’s clock error at 40.6 to 42.2 minutes.
One reply is left: the ephemeris is the model in dispute, so checking his sky against DE421 assumes what it sets out to prove. It would, if the ephemeris were checked against nothing else. Every test of it on this page runs through his own material, on days when nothing was at stake: the Naval Observatory tables on his slide agree with it to 0.08°; his camera, solved on the Sun alone, finds the Moon a median 0.63° from where it puts it on three nights in March; his published boresight comes back out of his footage to within a degree; his dark frames date totality to the minute it gives. If DE421 did not describe his sky, his instrument would have said so three weeks before the eclipse, and it said the opposite.
The model that says where the Moon was on those nights in March is the same model that says where the bite sat on 8 April. There is no version of this where the framework is reliable in March and unreliable on the one afternoon its answer is unwelcome. The whole of the disagreement is one substitution: the motion the whole sky shares, used where the motion of one body relative to another belongs.
What would change our mind
- A post-totality frame from his camera with the bite still on the lower right. The three he shows have it at the top, as predicted; a fourth that did not would break the account above directly.
- A worked derivation in which the approach direction of an eclipsing body is predicted from the shared daily arc. We do not think one exists, but it is what the claim needs.
- A totality time materially different from 15:18 at his coordinates, which would mean the ephemeris used here does not describe his sky.
- Photographs from elsewhere on the 2024 path showing the Moon arriving at the same angle it did at Erie. The account above says the angle slid from about 45° in Mazatlán to 35° in Montreal, because the observer’s own place on the globe is a term in it. Millions of people photographed that eclipse; if the angle is flat along the path, that term is not real and the account above is wrong on that point.
Where this page could be wrong
- Parallax is not in the account above, and it is not negligible. The Moon’s position seen from the Earth’s surface differs from its position seen from the centre by up to about a degree — more than the Sun’s diameter, and the reason eclipse tracks are narrow strips. The tables are topocentric and so include it; the argument above is told without it.
- His camera’s roll is assumed. “Lower right” is a claim about a level frame. If the Nikon was rotated when the 14:28 frame was taken, the match to his photograph is weaker than stated — though the rotation of the bite through the event does not depend on it.
- His working files are not published. The broadcast was watched in full and the two spoken quotations checked against the audio, but his measurements reach this page through his slides and through the raw time-lapse footage he included, not through the tracking he did on his own frames. Where his slides and his working differ, this page answers the slides.
- “15, 20 degrees” is a co-host’s estimate off a slide, not a figure Jeremy McGarry claims, and nothing here rests on it. It is one of the page’s two spoken quotations, and has been checked against the audio.
- The dark window is read as totality because of what the frames show and when they show it — the Sun reduced to a point, twilight colour on both horizons at once, the whole thing over inside four minutes. A thick enough cloud at exactly the computed minute would look different in the horizon glow but similar in the pixel counts, which are what the table gives; the frames are reproduced above.
- The angles measured off his slide are measured off a screen recording of it, at 1280 × 720, three generations from the original. A degree or two either way is not recoverable, and nothing in that section turns on it.
- The nine degrees the page attributes to standing on the surface is the newest claim here and the least cross-checked. It is a robust output of the ephemeris — the geocentric track (seen from the Earth’s centre) is steady to a tenth of a degree while the topocentric one moves with the observer — but it has not been checked against photographs from a second site, which is exactly the check it invites.
How to check this yourself
Everything in the tilt and bite tables comes out of one script with no reference to any of his material:
python3 eclipse_trajectory.pyIt takes a latitude, a longitude and a date, and prints the two motions, the sweep-versus-approach ratio, and the bite direction at each moment. The only inputs are his published coordinates and the ephemeris. There is no fitted parameter in it, and nothing in it was tuned to reproduce his photograph — that it does is the result, not the method. The five-act scene has its own builder, python3 build_eclipse_mechanics.py, which writes every position, rotation, node (where the orbit crosses the ecliptic) and contact time the scene draws, runs its own checks — the full Moon opposite the Sun, the orbit’s tilt and nodes where they should be, Erie inside the umbra for as long as the contact times say and Montreal only just, by eight kilometres — and refuses to write the file if any of them fails.
Method notes
The plate solution. Every distinct frame of his 23–25 March footage was searched for bright compact sources and these sorted into tracks by motion alone (a cloud edge sparkles for a frame; a streetlight sits at one pixel for three days). Six tracks came out, and only six. The Sun row of the residual table is 556 of the 722 positions, the other 166 being frames where cloud outweighed the disc or the disc sat in a corner the lens model does not reach; nothing is rejected from the Moon. The camera is modelled as an equidistant fisheye with one radial term, the order chosen by the body the fit never saw — one distortion term beats two, three and four on the held-out Moon. Residuals are pixel error over focal length. The solution puts the lens’s axis 23 pixels right of the frame’s centre; that offset reconciles the fitted boresight with his published 187.9°, and it is fitted rather than measured — if it is wrong, the frame-centre figures stand and the fitted ones move.
7 April and eclipse afternoon. The 7 April row uses the March solution unchanged, with the clock taken from the eclipse itself; his own landmarks — the isolated spruce tip and the left roofline — align to within three pixels between the two dates, so the camera had not moved. Before totality on 8 April, Erie is under broken cloud — twenty to forty-six bright patches a frame. From 15:45 the Sun is recovered, but the 1.5° residual is systematic: the single radial term of the lens under-bending at large radius, 5 px at mid-frame and 16 px near the corner, and by 17:19 the Sun is predicted outside a 1280-pixel frame altogether. A degree and a half of lens error is not a measurement to put beside 0.63°. Rebuild with python3 apr_track2.py and apr_export2.py; positions at data/erie-eclipse-day-pixels.csv.
The five-act scene. The Moon’s loop is its own hourly track for the month, the orbital plane fitted to it and the nodes found where it crosses the ecliptic. Sites are tested against the cone second by second rather than against the nearest sample of a track that moves sixty kilometres a minute. The clock stands still through act 2 and otherwise only runs forward; act 5 holds at 15:17:35 while his frame fades in. A rectilinear camera cannot draw a hundred degrees of field, so the scene is rendered from Erie into a cube map and looked up pixel by pixel through his own plate solution; through his lens the two bodies are six pixels apart all afternoon, which is why the inset exists. The Earth texture is the selenelion page’s, loaded from there rather than copied.
Sources & further reading
- The argument is Jeremy McGarry’s, presented as a guest on What Did the Sun ECLIPSE? | w/ Jeremy McGarry, streamed 19 June 2024 on Hanging On His Words. The copy consulted here is a rebroadcast within an unlisted upload titled sun observations on the Shape Debate YouTube channel — the channel of shapedebate.com, which the book’s own QR reaches; the embedded portion begins at 24:04. The two recordings have been compared and are the same broadcast, the re-upload slightly trimmed. Quotations are read off the slides in frame, except the two marked as spoken; figures attributed to his footage come from the two raw camera segments played within the broadcast.
- Positions computed from JPL’s DE421 ephemeris via Skyfield, topocentric for 42.129° N, 80.085° W.
- Levi Miller, Globe Deconstruction? (prerelease) — p. 2 (Claim #3, the four red flags, of which this is the fourth), pp. 165–167 (the observation lists and the QR codes).
- The other limbs of the same claim: Where’s the Moon’s Silhouette?, Full-Moon Lighting, The Moon-Tilt Illusion and Jupiter’s Shadows. The first half of the same video argues that sunset is perspective convergence, answered at Perspective Cannot Make a Sunset and The Sun Does Not Shrink.